I have divided this into two parts:
Part A: discuss about how to setup counters and how to collect the data for analysis.
Part B: discusses about the performance counters which are to be used in sql server and threshold limits.
A. SQL Server: Performance Counters Setup-Collect-Analyze
B. SQL Server: Performance Counters- Thresholds
SQL Server: Performance Counters Setup-Collect-Analyze
Setting up Performance Monitor Counters
Step 1:
How can we setup Performance Monitor to collect data all of the time, so we can go back and review the data when needed?
- Perf-Mon comes with all OS versions – best to use this as it is free J
- There are many ways to configure this tool : I would like to share the method that I have been using and it how it has worked for me
P.S --:There is no exact threshold for lot of the counters to determine if there is an issue on your server, so it is very important to collect performance counter data while the server is running healthy, so you can give yourself a baseline to measure against J
Start Perfmon:
There are many ways to start perfmon and here are a few methods.
There are many ways to start perfmon and here are a few methods.
- Click Start --: click Run then type perfmon.msc or perfmon in the Open box
- Start --: Control Panel > Administrative Tools > Performance Monitor
- launch PerfMon.exe
When it starts you will get a screen like the following:
Performance monitor in Windows 2008 / Windows 7 / and new editions of Windows
Performance monitor in Windows 2003 / XP / old versions of Windows
Here we will work on latest version of perfmon.
In above picture we can see the following items:
- Last - this is the last value that was captured for this counter
- Average - this is the average value for the duration
- Minimum - this is the minimum value for the duration
- Maximum - this is the maximum value for the duration
- Duration - this is the total collection time period and in this case it is 1:40 which is 1 minute and 40 seconds
Counter "% Processor Time" that is being tracked
Counter "% Available MBytes" that is being tracked
Counter "% Usage" that is being tracked
From this we can tell when there are peaks for specific counters that may be causing performance issues.
Right Click on User Defined --: New --: Data Collector Sets --:
Click add and you will get one more popup to add counters as below
For production servers, obviously you don't want to collect data every 15 seconds which may put too much pressure on your server and also waste storage as well. Depending on what you do, you may want to choose to collect every 1 min to every 15min. I do not recommend setting longer then 10 min though, because that may not capture enough information to troubleshoot an issue. I will choose every 1 minute for this example.
If you are not sure what information the counter will give you, you can click "Explain", it will open another window and offer an explanation of the counter that you chose. Here is the example
Click next and browse to location where you want to save your logs. Don’t save the performance logs data on C: drive as there might be chance that C: will run out of space.
if you are collecting to the server locally, you do not need to set "Run As:" but if you are collecting data from a remote server, then you need to set the service account, which has proper permissions to collect the data. The service account needs to have at least "Profiler system performance" rights from Local Security Settings. For more information, you can read this article: http://www.microsoft.com/technet/prodtechnol/windows2000serv/reskit/gp/551.mspx?mfr=true
Setting Collector Properties:
This will decide how the data will be stored once it is collected. For this example I chose "Text file (Comma delimited)" and chose "End file names with: yyyymmdd"
This will decide how the data will be stored once it is collected. For this example I chose "Text file (Comma delimited)" and chose "End file names with: yyyymmdd"
Right click on data collector for documentation -> properties
In description we can give brief detail about this collector; this will be beneficial if no. of collectors is running over the server.
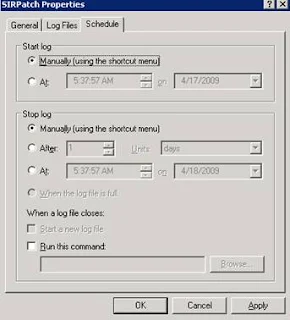
You can modify location of logs and schedule of collector using below setting
Now go to datacollector01à Propertiesà
Here we can decide naming convention of logfiles and logmode
Once we are done with settings, Go to “data collector for documentation” right click à start
I had led it run for 1 hour and then stopped it. Once your data collection is done Go to and click red arr-owed
And you will get below
Now you got completed graph but to analyze this data we need to store in excel file.
Export Your Performance Monitor Data to Excel:
Performance Monitor in Windows Server gives us the ability to see when our servers are having some issues. Analyzing that data into something meaningful can be a problem. You can export your data to Excel so you can better see what your performance data represents.
First collect your data
First collect your data
Right click the graph and select Save Data As.
Change the Save as type to Text file (comma delimited)(*.csv).
Give the file a name and save it where you want to store it. Now open that file on a client with Excel installed on it. By using excel, you will be able to present the data in a more meaningful format.
Change the Save as type to Text file (comma delimited)(*.csv).
Give the file a name and save it where you want to store it. Now open that file on a client with Excel installed on it. By using excel, you will be able to present the data in a more meaningful format.
I saved log as : Performance_analysis.csv
Now I will show you how I use Excel to analyze the data to help determine where your bottlenecks may be and also an easy way to create quick reports and charts for your SQL Servers.
Step 1: Open the csv file
Once you have collected the performance data you can open the csv file using Excel and you should see data similar to the following.
Step 2: Adjust the format
To allow easy reporting of the data there are a few things that I do to adjust the data.
- Replace server name with an empty string - it helps to make reading the counter names easier. In this case I am replacing " \\SAURABHSINHA-PC" the name of my server to nothing. (This is optional, but recommended)
- Cell - A1: Replace "(PDH-CSV 4.0) (Pacific Standard Time)(480)" with "Time IST" (Optional, but recommended)
- Change COLUMN A cell format to "date time" and this will be like
Step 3: Create PivotTable with PivotChart
- From the Insert menu select PivotTable and then select PivotChart as shown below
- Take the default settings and click "OK"
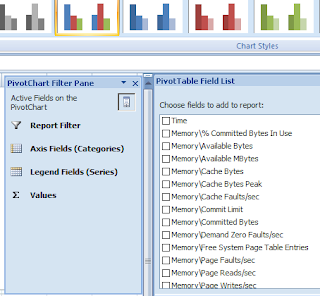
<![if !supportLists]>· <![endif]>After you select the above you will get a screen similar to the following. (to get a bigger workspace area you can close the "PivotChart Filter Pane")
Step 4: Let's generate our first graph
For this example we will look at CPU
- From the "PivotTable Field List" select "Time" and drag it into the "Axis Fields (Categories)" area
- From the "PivotTable Field List" select "Memory\Available MBytes" and drag it into the "Values" area
- At this point you will have a graph similar to the one shown below
· You can now just select the chart and copy and paste it into a report, an email, Word document etc... as shown below
· If you want to change it from processor time to batch requests you can remove " Memory\Available MBytes" and select "Memory\System Cache Resident Bytes" and you will get a chart like below

How can we we run Perfmon during processing window/during data load window.
Here is the solution:
To start and stop this collection of counters called datacollector we can issue the following commands from the Windows command line, from a batch job or from a job step in a SQL Server job.
http://technet.microsoft.com/en-us/library/cc788121(v=ws.10).aspx
To start
logman start perf_log -s server_1
To Stop
logman stop perf_log
After you start and stop the data collection, it will create collection as earliear. This file can then be opened with the Performance Monitor tool to see the data for the counters that you just collected.
If you run the commands again it will create a new data collection, so the first file is not overwritten.
References :
http://saurabhsinhainblogs.blogspot.in/2016/01/script-to-collect-performance-metrics.html
http://saurabhsinhainblogs.blogspot.in/2016/01/script-to-collect-performance-metrics.html


Hello,
ReplyDeleteThanks Saurabh Sinha for sharing a valuable post regarding Windows server. This post gives so many informative information which makes my day. Windows Server refers to any type of server instance that is installed, operated and managed by any of the Windows Server family of operating systems. Thanks!!!