Prepare and Transform Data in the Lakehouse
Objective:
- Task 1: Upload existing notebooks.
- Task 2: Transform data and load to silver Delta table
Please go through Lab -1 & Lab - 2 and Prepare the Machine and data
From the previous exercise steps,
We have raw data "wwi-raw-data" ingested from the source "https://azuresynapsestorage.blob.core.windows.net/sampledata" to the Files section of the lakehouse. Now you can transform that data and prepare it for creating delta tables.
Microsoft Fabric Labs
- Azure Microsoft Fabric - Lab -1 for Beginners:
- Azure Microsoft Fabric - Auto Power BI Reports Lab -2:
- Microsoft Fabric - Ingest data into the Lakehouse Lab - 3:
- Microsoft Fabric - Lakehouse and Data Transformation - Lab - 4:
- Microsoft Fabric and Power BI Reports Lab - 5:
- Microsoft Fabric - Resource Cleanup in Lab -6
Steps to Upload the Notebook:
- Now, click on Fabric Lakehouse Tutorial-XX on the left-side navigation pane
- In the Fabric Lakehouse Tutorial-XX workspace page, click on the drop-down arrow in the +New button, then select Import notebook.
- Select Upload from the Import status pane that opens on the right side of the screen.
- Navigate to C:\LabFiles\Lakehouse Tutorial Source Code, select 01-Create Delta Tables, 02-Data Transformation-Business Aggregation notebook, and click on Open.
- You will see a notification stating Imported successfully.


- After the import is successful, to see the newly imported notebooks select Fabric Lakehouse Tutorial-XX under the Recommended section.
- In the Fabric Lakehouse Tutorial-XX pane, Select wwilakehouse Lakehouse to open it.


Task 2: Transform data and load to Delta table
- In the wwilakehouse page, select Open notebook > Existing notebook from the top navigation menu (You can also Build a new notebook, All codes are shared below).
- From the list of Open existing notebooks, select the 01 - Create Delta Tables notebook and select Open.
- In the opened notebook in Lakehouse Explorer, you see the notebook is already linked to your opened lakehouse.


Note: Fabric provides the V-order capability to write optimized delta lake files. V-order often improves compression by three to four times and up to 10 times performance acceleration over the Delta Lake files that aren't optimized. Spark in Fabric dynamically optimizes partitions while generating files with a default 128 MB size. The target file size may be changed per workload requirements using configurations. With the optimized write capability, the Apache Spark engine reduces the number of files written and aims to increase the individual file size of the written data.
- Before you write data as delta lake tables in the Tables section of the lakehouse, you use two Fabric features (V-order and Optimize Write) for optimized data writing and for improved reading performance. To enable these features in your session, set these configurations in the first cell of your notebook.
- To start the notebook and execute the cell, select the Run icon that appears to the left of the cell upon hover.
- Next, you read raw data from the Files section of the lakehouse, and add more columns for different date parts as part of the transformation. you use partitionBy Spark API to partition the data before writing it as a delta table based on the newly created data part columns (Year and Quarter).
- To execute the second cell, select the Run icon that appears to the left of the cell upon hover.

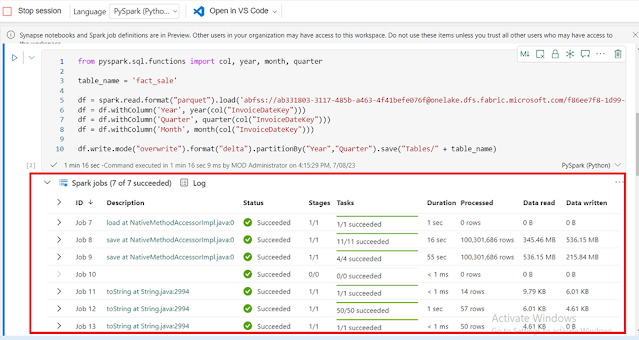
- After the fact tables load, you can move on to loading data for the rest of the dimensions. The following cell creates a function to read raw data from the Files section of the lakehouse for each of the table names passed as a parameter. Next, it creates a list of dimension tables. Finally, it loops through the list of tables and creates a delta table for each table name that's read from the input parameter.
- Select the cell and select the Run icon that appears to the left of the cell upon hover.


- Go to the items view of the workspace again select Fabric Lakehouse Tutorial-XX and select the wwilakehouse lakehouse to open it.
- Now, open the second notebook. In the lakehouse view, select Open notebook > Existing notebook from the ribbon.
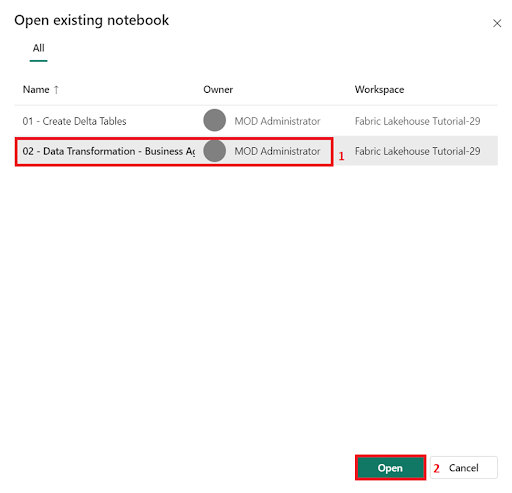
- From the list of Open existing notebooks, select the 02 - Data Transformation - Business Aggregation notebook and click on the Open.
- In the open notebook in Lakehouse Explorer, you see the notebook is already linked to your opened lakehouse.
- To start the notebook select the 1stcell and select the Run icon that appears to the left of the cell upon hover.


- An organization might have data engineers working with Scala/Python and other data engineers working with SQL (Spark SQL or T-SQL), all working on the same copy of the data. Fabric makes it possible for these different groups, with varied experiences and preferences, to work and collaborate. The two different approaches transform and generate business aggregates. You can pick the one suitable for you or mix and match these approaches based on your preference without compromising on the performance:
- Approach #1 - Use PySpark to join and aggregate data for generating business aggregates. This approach is preferable to someone with a programming (Python or PySpark) background.
- Approach #2 - Use Spark SQL to join and aggregate data for generating business aggregates. This approach is preferable to someone with an SQL background, transitioning to Spark.
- Use PySpark to join and aggregate data for generating business aggregates.
- With the following code, you create three different Spark dataframes, each referencing an existing delta table.
- Then you join these tables using the dataframes, do group by to generate aggregation, rename a few of the columns, and finally write it as a delta table in the Tables section of the lakehouse to persist with the data.
- In this cell, you create three different Spark dataframes, each referencing an existing delta table.
- Execute the cell by clicking on the Run icon.
- In this cell, you join these tables using the dataframes created earlier, do group by to generate aggregation, rename a few of the columns, and finally write it as a delta table in the Tables section of the lakehouse.
- Execute the cell by clicking on the Run icon.


- Use Spark SQL to join and aggregate data for generating business aggregates.
- With the following code, you create a temporary Spark view by joining three tables, do group by to generate aggregation, and rename a few of the columns.
- Finally, you read from the temporary Spark view and finally write it as a delta table in the Tables section of the lakehouse to persist with the data.
- In this cell, you create a temporary Spark view by joining three tables, do group by to generate aggregation, and rename a few of the columns.
- Execute the cell.
- In this cell, you read from the temporary Spark view created in the previous cell and finally write it as a delta table in the Tables section of the lakehouse.
- Execute the cell by clicking on the Run icon.


- Microsoft Fabric and Power BI Reports Lab - 5:
No comments:
Post a Comment