Creating a Lakehouse, Ingesting Sample Data
Fabric with its unification of data store and standardization on Delta Lake format allows you to eliminate silos, remove data duplicity, and drastically reduce total cost of ownership.
With the flexibility offered by Fabric, you can implement either lakehouse or data warehouse architectures or combine them together to get the best of both with simple implementation.
This lab explains how a developer at the fictional Wide World Importers company from the retail domain completes the following steps:
This lab explains how a developer at the fictional Wide World Importers company from the retail domain completes the following steps:
Microsoft Fabric Labs
- Azure Microsoft Fabric - Lab -1 for Beginners:
- Azure Microsoft Fabric - Auto Power BI Reports Lab -2:
- Microsoft Fabric - Ingest data into the Lakehouse Lab - 3:
- Microsoft Fabric - Lakehouse and Data Transformation - Lab - 4:
- Microsoft Fabric and Power BI Reports Lab - 5:
- Microsoft Fabric - Resource Cleanup in Lab -6
Objectives
- Sign in to
Power BI account and initiate a free Microsoft Fabric trial.
- Start the
Microsoft Fabric (Preview) trial within Power BI.
- Configure
OneDrive sign-up for the Microsoft 365 admin center.
- Build and
implement an end-to-end lakehouse for the organization, including creating
a Fabric workspace and a lakehouse.
- Ingest sample
data into the lakehouse and prepare it for further processing.
- Transform and
prepare the data using Python/PySpark and SQL notebooks.
- Create business
aggregate tables using different approaches.
- Establish
relationships between tables for seamless reporting.
- Build a Power
BI report with visualizations based on the prepared data.
- Save and store the created report for future reference and analysis.
Exercise 1: Setup Lakehouse end-to-end scenario
Task 1:
- Sign in to Power BI account and sign up for the free Microsoft Fabric trial
- Open your browser, navigate to the address bar, and type or paste the following URL: https://app.fabric.microsoft.com/ then press Enter.

2. In the Microsoft Fabric window, enter your Microsoft 365 credentials from the Resources tab, and click on the Submit button.


Task 2: Start the Microsoft Fabric (Preview) trial
Follow these steps to start your Fabric (Preview) trial.
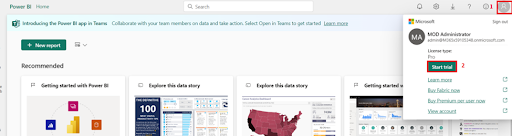
- On the Power BI Home page, click on the Account Manager for Administrator icon on the top right corner of the page.
- In the Account Manager blade, navigate and select Start Trial as shown in the below image.


Task 3: Ingest First Dimension
- Open your browser, navigate to the address bar, and type or paste the following URL: https://admin.microsoft.com/AdminPortal/Home#/homepage then press the Enter button.
- Click on the App launcher from the top left corner of the Microsoft 365 admin center page.
- In the Microsoft 365 page from the Apps pane select OneDrive
- In One Drive page, under Securely store and share files select Your One Drive is ready


Exercise 2: Build and implement an end-to-end lakehouse for your organization
Task 1: Create a Fabric workspace
In this task, you create a Fabric workspace. The workspace contains all the items needed for this lakehouse tutorial, which includes
- Lakehouse
- Dataflows
- Data Factory pipelines
- the notebooks
- Power BI datasets
- Reports
Steps:
- Back in the Power BI page, select Workspaces from the left side navigation menu.
- In the Workspaces pane Select + New workspace.
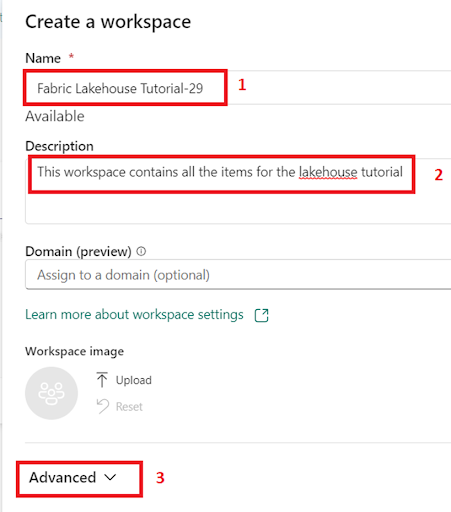
- In the Create a workspace tab, enter the following details and click on the Apply button.
- Wait for the deployment to complete. It takes 2-3 minutes to complete
|
Name |
Fabric Lakehouse Tutorial-XX (XX can be a unique number) (here, we
entered Fabric Lakehouse Tutorial-29) |
|
Description |
This workspace contains all the
items for the lakehouse tutorial |
|
Advanced |
Under License mode, select Trial |
|
Default storage format |
Small dataset storage format |
|
Template apps |
Check the Develop template apps |


Task 2: Create a lakehouse
- In the Power BI Fabric Lakehouse Tutorial-XX page, click on the Power BI icon located at the bottom left and select Data Engineering under Synapse.
- In the Synapse Data Engineering Home page, select Lakehouse(Preview) to create a lakehouse.
- In the New lakehouse dialog box, enter wwilakehouse in the Name field, click on the Create button.
- You will see a notification stating Successfully created SQL endpoint.


Task 3: Ingest sample data
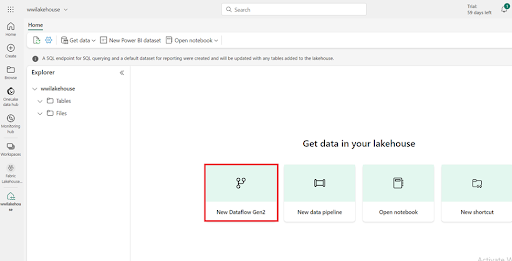
- In the wwilakehouse page, under Get data in your lakehouse section, click on New Dataflow Gen2 as shown in the below image.
- On the Dataflow canvas, navigate and click on Import from a Text/CSV file.
- On the Connect to data source pane, select the Upload file(Preview) radio button. Click on Browse button and browse your VM to C:\LabFiles and then select dimension_customer.csv file. Select Open.
- In the Connect to data source pane select Next.
- From the Preview file data page, preview the data and select Create to proceed and return back to the dataflow canvas.
- In the Query settings pane on the right side of the Dataflow canvas, ensure that dimension_customer is selected under the Name field. Similarly, ensure that Lakehouse is selected under the Data destination field.
Note:
o If needed, from the Connect to data destination screen, sign into your account. Select Next.
o Navigate to the wwilakehouse in your workspace.
o If the dimension_customer table doesn't exist, select the New table setting and enter the table name dimension_customer. If the table already exists, select the Existing table setting and choose dimension_customer from the list of tables in the object explorer. Select Next.
Fabric adds a space and number at the end of the table name by default. Table names must be lower case and must not contain spaces. Please rename it appropriately and remove any spaces from the table name.*


- Refreshing data will take around 5-6 min.
- Once the dataflow is refreshed, select wwilakehouse in the left navigation panel to view the dimension_customer delta table. Select the table to preview its data.
- You can also use the SQL endpoint of the lakehouse to query the data with SQL statements. Select SQL endpoint from the Lakehouse drop-down menu at the top right of the screen.


- In the wwilakehouse page, under Explorer select the dimension_customer table to preview its data and select New SQL query to write your SQL statements.
- The following sample query aggregates the row count based on the BuyingGroup column of the dimension_customer table. SQL query files are saved automatically for future reference, and you can rename or delete these files based on your need. Paste the code as shown in the below image, then click on the play icon to Run the script.
/***********************/
SELECT BuyingGroup, Count(*) AS Total
FROM dimension_customer
GROUP BY BuyingGroup
/***********************/


Proceed to the next lab to build the report on the Database
Summary: This practical lab focuses on setting up and configuring essential components within Microsoft Fabric and Power BI for data management and reporting. It includes tasks like activating trials, configuring OneDrive, creating workspaces, and setting up lakehouses. The lab also covers tasks related to ingesting sample data, optimizing delta tables, and building reports in Power BI for effective data analysis. The objectives aim to provide hands-on experience in utilizing Microsoft Fabric and Power BI for data management and reporting purposes.
Microsoft Fabric Labs
- Azure Microsoft Fabric - Lab -1 for Beginners:
- Azure Microsoft Fabric - Auto Power BI Reports Lab -2:
- Microsoft Fabric - Ingest data into the Lakehouse Lab - 3:
- Microsoft Fabric - Lakehouse and Data Transformation - Lab - 4:
- Microsoft Fabric and Power BI Reports Lab - 5:
- Microsoft Fabric - Resource Cleanup in Lab -6
No comments:
Post a Comment