Explore Azure Databricks
Step 1. Setup Azure Databricks Workspace and open notebook
Steps are available: https://saurabhsinhainblogs.blogspot.com/2024/01/azure-databricks-lab-how-to-start-with.html
- Connect to Azure Portal
- Setup Azure Datbricks
- Setup Cluster for Azure Databricks
- Open Notebook
Step 2. Prepare Data to consume
- Go to the URL: https://raw.githubusercontent.com/MicrosoftLearning/mslearn-databricks/main/data/products.csv
- Download data in CSV file, I named the file product.csv
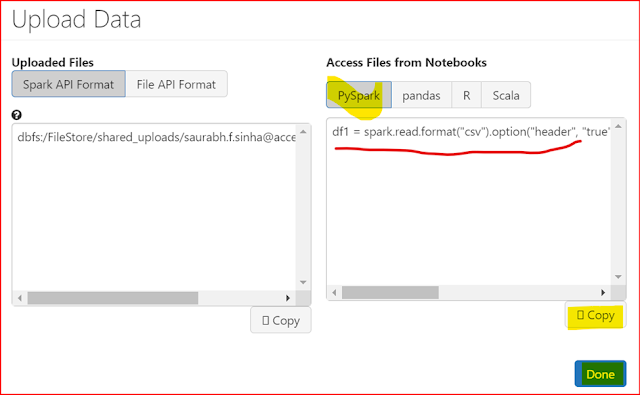
- On the File menu, select Upload data to DBFS.
- In the Upload Data dialog box, note the DBFS Target Directory to where the file will be uploaded.
- Then select the Files area, and upload the products.csv file you downloaded to your computer.
- When the file has been uploaded, select Next
- In the Access files from notebooks pane, select the sample PySpark code and copy it to the clipboard.
- You will use it to load the data from the file into a data frame. Then select Done.
Step 3. Execute code in Notebook
- In the notebook, in the empty code cell, paste the code you copied; which should look similar to this:
- Use the ▸ Run Cell menu option at the top-right of the cell to run it, starting and attaching the cluster if prompted.
- Wait for the Spark job run by the code to complete. The code has created a data frame object named df1 from the data in the file you uploaded.
Code:
df1 = spark.read.format("csv").option("header", "true").load("dbfs:/FileStore/shared_uploads/a@b.com/products.csv")

Step 4. Display the contents of the data frame
- Under the existing code cell, use the + icon to add a new code cell. Then in the new cell, enter the following code:
- Use the ▸ Run Cell menu option at the top-right of the new cell to run it. This code displays the contents of the data frame, which should look similar to this:
Code:
print(df1)
df1.collect()
display(df1)



Step 5. Create Data Visualization and Data Profile
- Above the table of results, select + and then select Visualization to view the visualization editor, and then apply the following options:
- Visualization type: Bar
- X Column: Category
- Y Column: Add a new column and select ProductID. Apply the Count aggregation.

Step 6. Create and query a table
- Save the data frame as table object
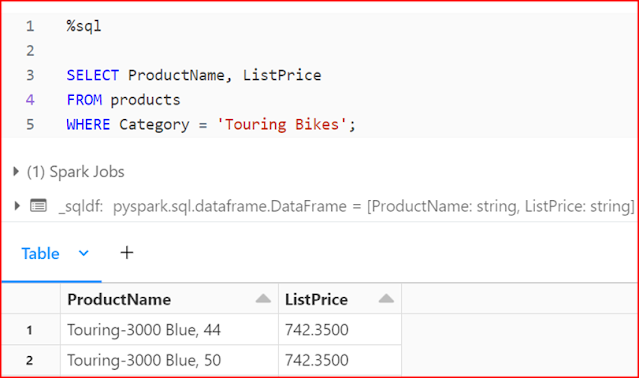
- SQL code to return the name and price of products in the Touring Bikes category.
Code:
df1.write.saveAsTable("products")
%sql
SELECT ProductName, ListPrice FROM products WHERE Category = 'Touring Bikes';

Now if you want, you can try a couple more options
Step Last. Cleanup Resources
- In the Azure Databricks portal, on the Compute page, select your cluster and select ■ Terminate to shut it down.
- If you’ve finished exploring Azure Databricks, you can delete the resources you’ve created to avoid unnecessary Azure costs and free up capacity in your subscription.
Thanks for the informative blog! Businesses seeking reliable data engineers in India can explore KloudPortal for experienced professionals and scalable data solutions. Learn more @ kloudportal. Data engineering Databricks Bronze Partner
ReplyDelete